Step 3: Start lesson 1 and have a look around

Students will explore pie graphs in more detail and interpret the data from different pie graphs.

Students will apply their knowledge of angles and data from collections to draw pie graphs.

Students will gather data and present it in a graph.

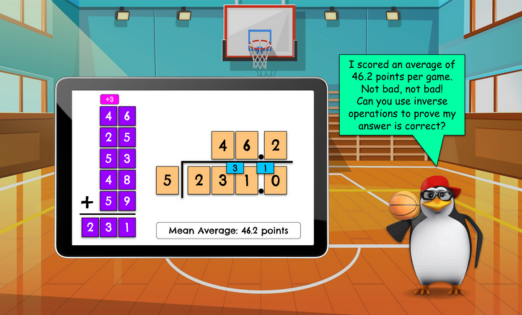
This lesson inquires into calculating the mean average of different data sets. It only covers the mean average, as median, mode and range are explored in the following lesson.

Students will explore and calculate the mean, mode, median and range of data sets. They will find the averages of the ‘hanging socks’.

Students will read a bus timetable and solve the animals’ problems by calculating elapsed time.

Students will explore probability vocabulary and use it to order the likelihood of events.

Students will play The Colour Game, which involves drawing coloured items out of a bag. They will use probability to make game predictions.

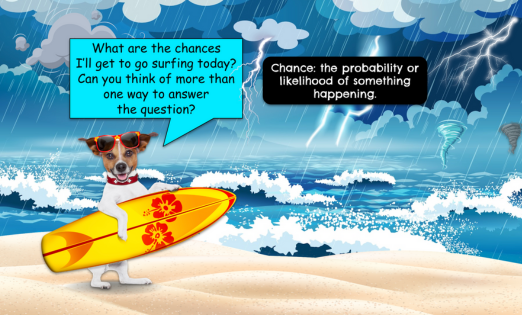
Students will continue to use probability to make predictions and use fractions to record their predictions and results. They will play the Turbo Snail Trail game.

This is a summative assessment that covers the key objectives from the statistics, probability and data unit.