Step 3: Start lesson 1 and have a look around
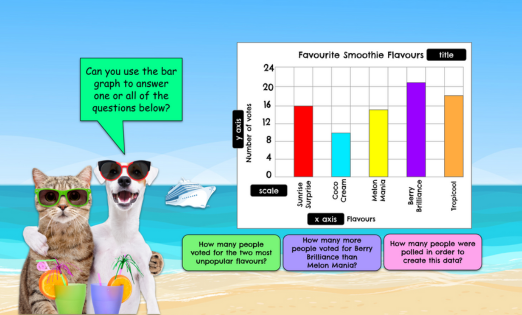
Students will explore bar graphs in more detail and create their own bar graph from frequency tables.
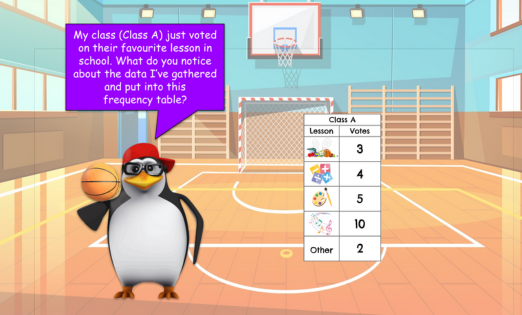
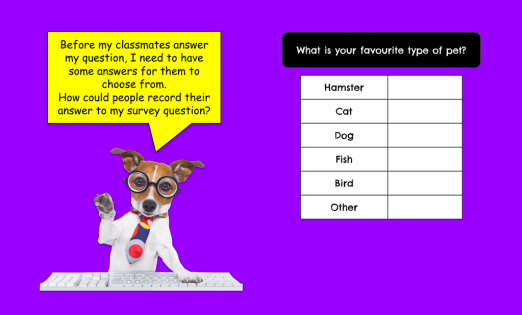
Students will conduct a survey and create a bar graph based on the survey.
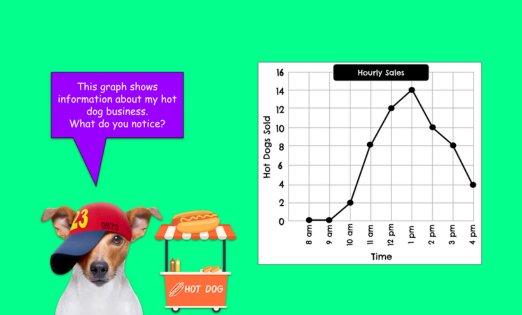
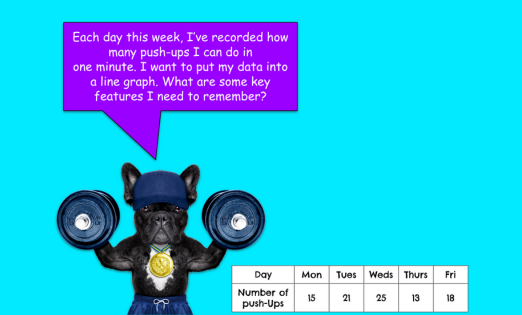
Students will explore line graphs and answer related questions.
Students will explore line graphs in more detail and create their own line graph from frequency tables.
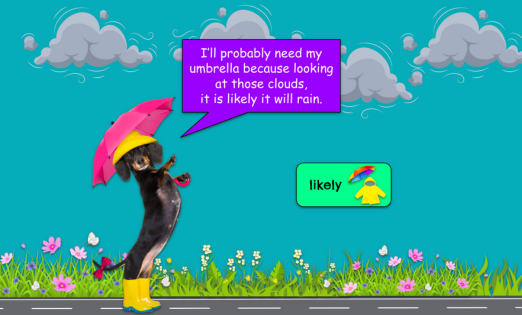
This lesson introduces students to probability vocabulary, such as impossible, unlikely, even chance, likely and certain. They will order event cards according to probability.
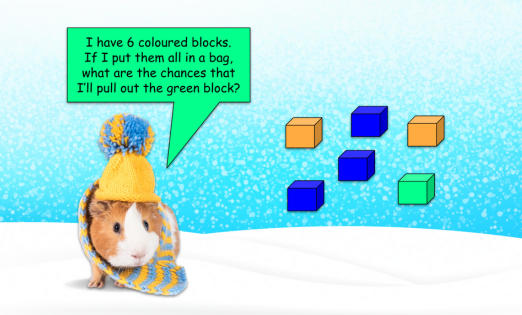
Students will play a game , called The Colour Game, involving drawing coloured items out of a bag. They will use probability to make game predictions.
This is a summative assessment that covers the key objectives from the Statistics, Probability and Data unit.