
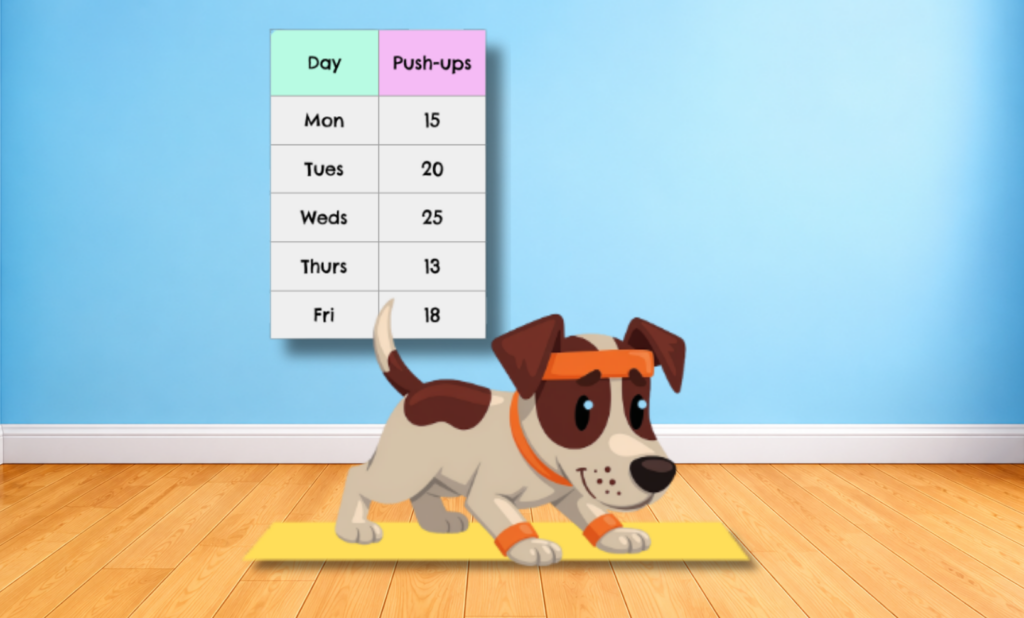
Lesson 5: Let’s create line graphs
Sorry, but you do not have permission to view this content.
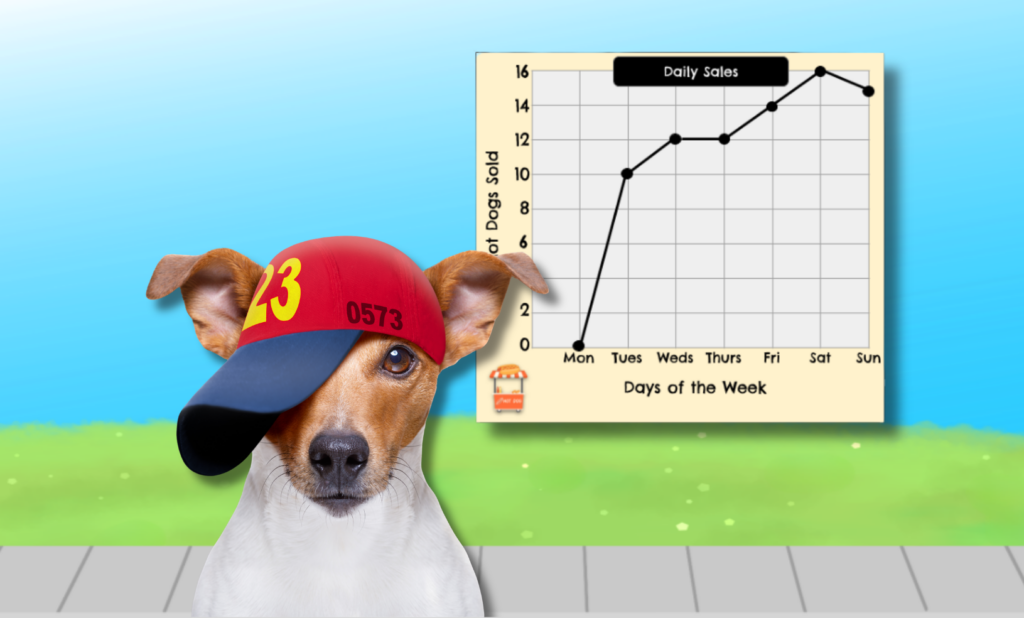
Lesson 4: Let’s interpret line graphs
Sorry, but you do not have permission to view this content.
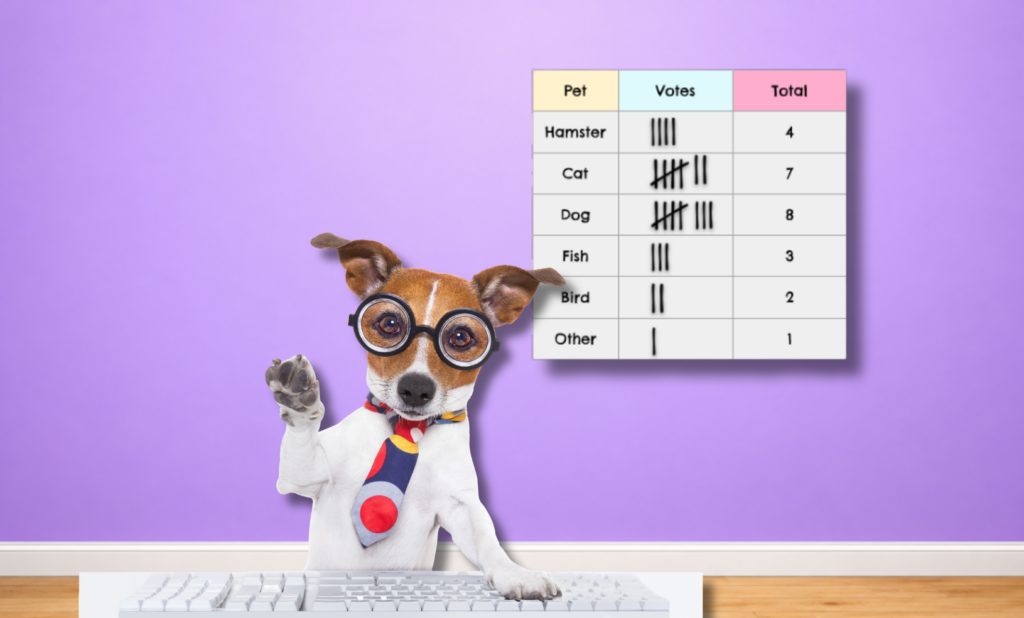
Lesson 3: Let’s gather and present data
Sorry, but you do not have permission to view this content.
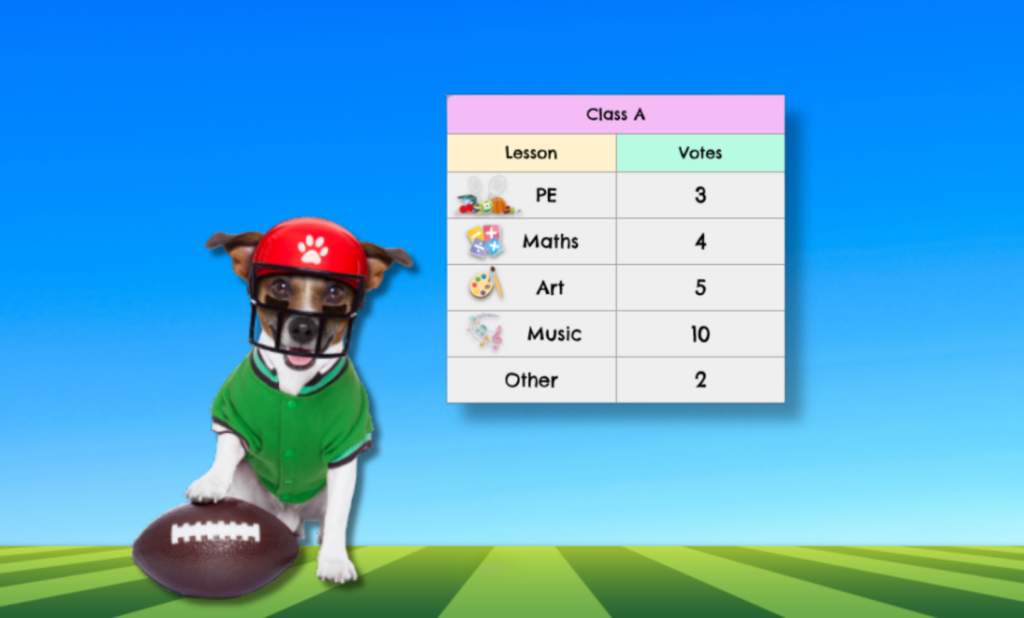
Lesson 2: Let’s create bar graphs
Sorry, but you do not have permission to view this content.
Lesson 1: Let’s interpret pictograms and bar graphs
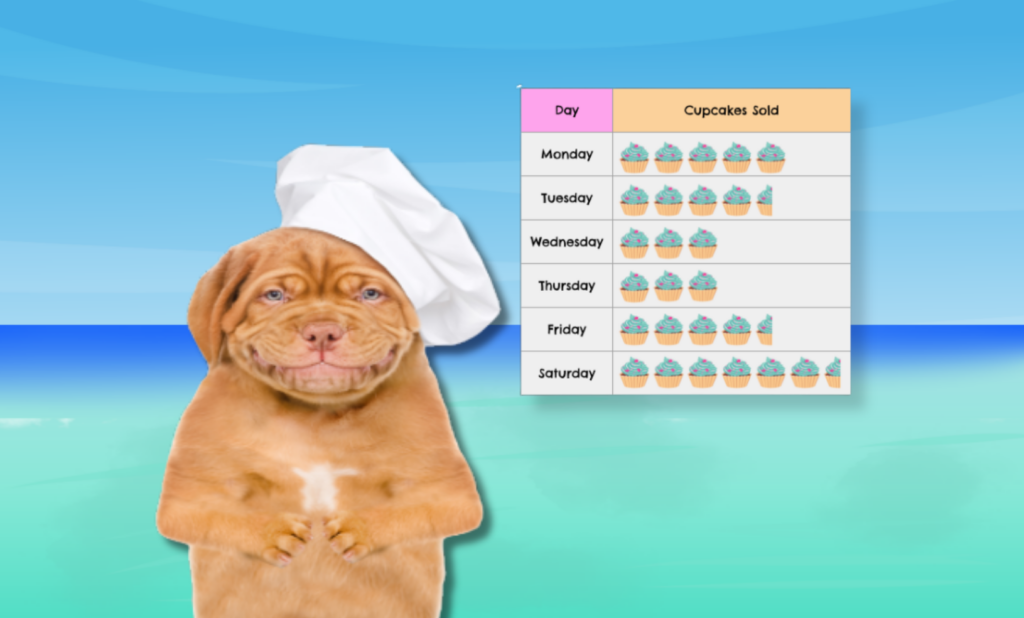
Students will explore pictograms and bar graphs and use their knowledge to answer related questions.
Lesson 8: Let’s show what we know!

This is a summative assessment that covers the key objectives from the Data and Probability unit.
Lesson 7: Let’s explore chance and probability
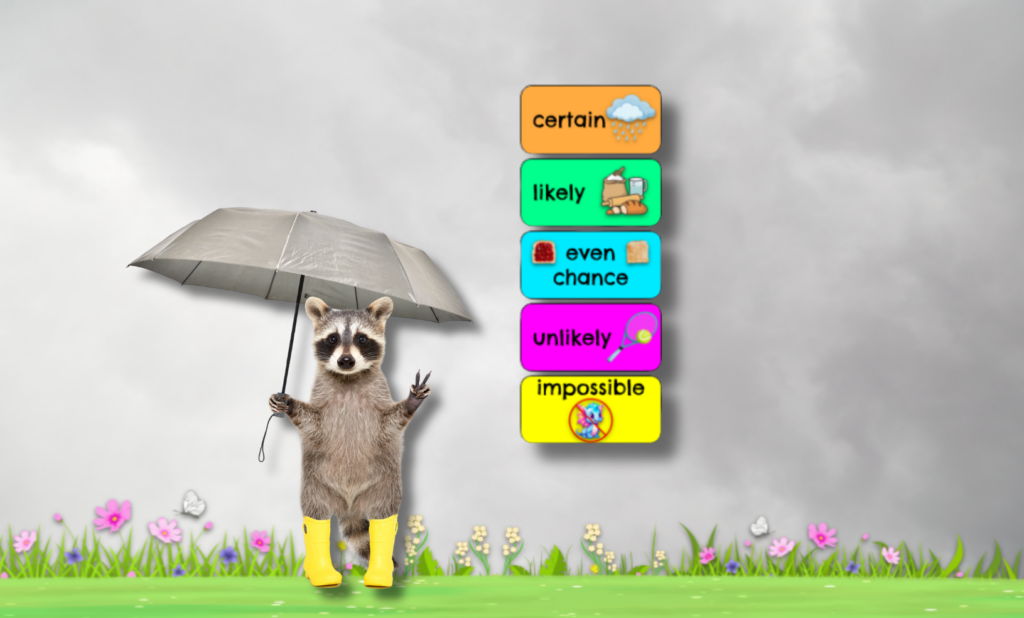
This lesson introduces students to probability vocabulary, such as impossible, unlikely, even chance, likely and certain. Students will apply a probability word to different scenarios.
Lesson 6: Let’s present data in a bar graph
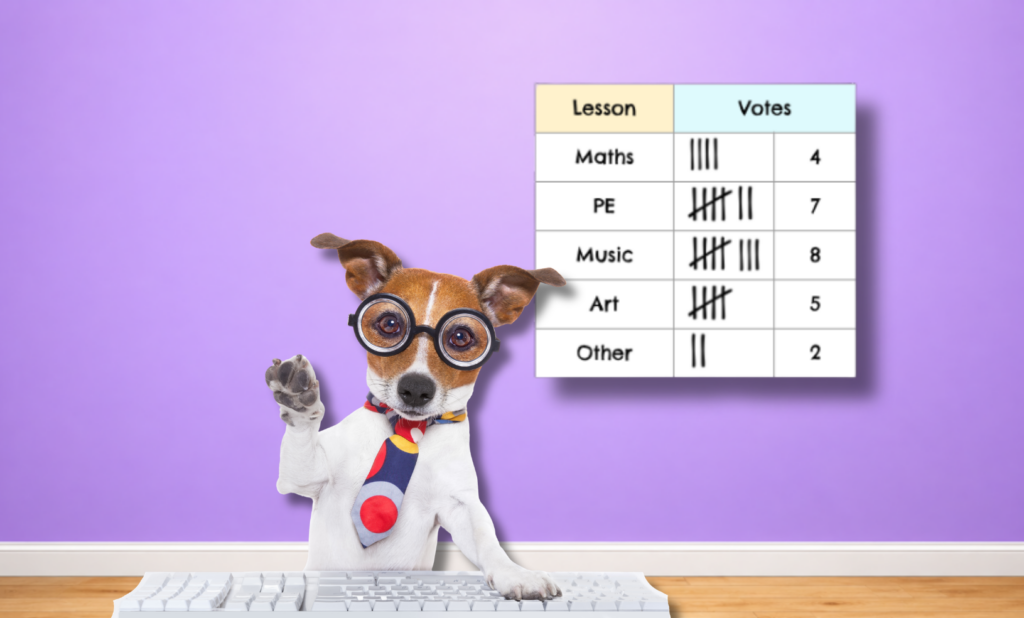
Students will conduct an inquiry and create a bar graph based on their findings.
Lesson 5: Let’s create bar graphs
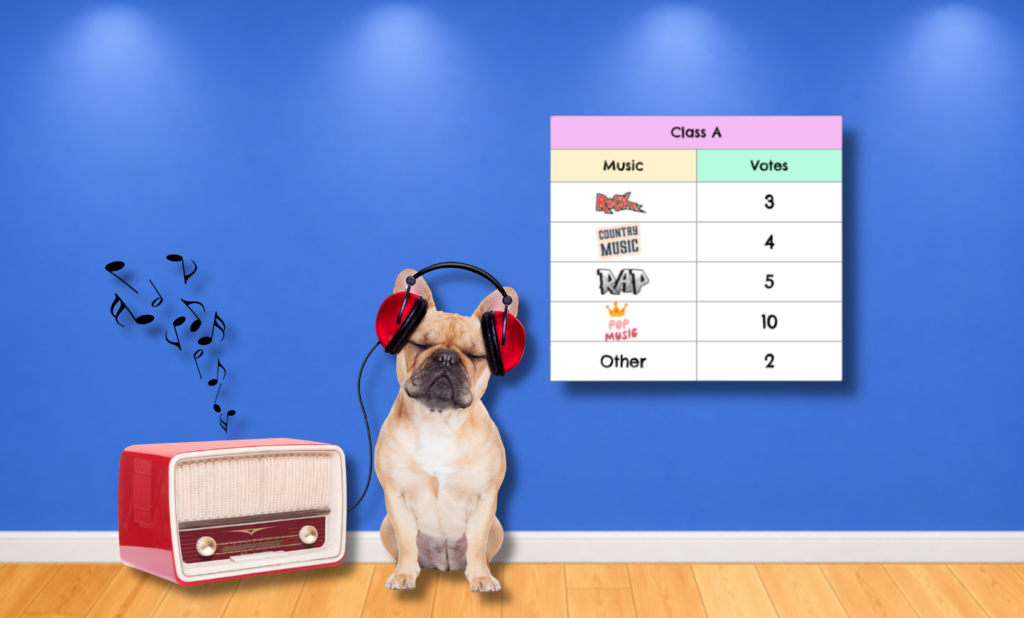
Students will explore bar graphs in more detail and create their own bar graph from frequency tables.
Lesson 4: Let’s interpret bar graphs
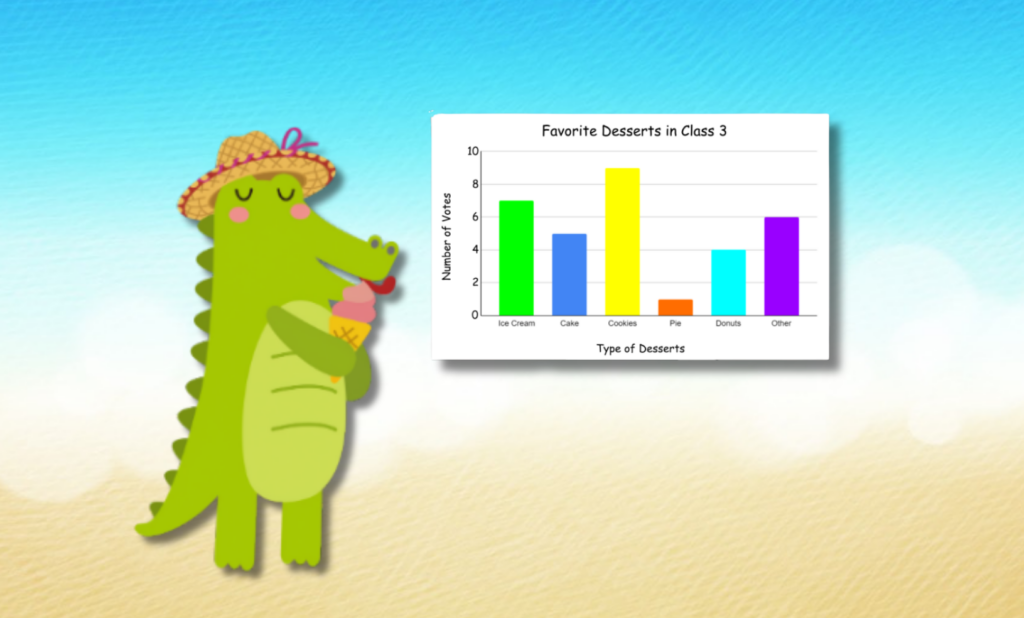
Students will explore bar graphs and answer questions connected to the graphs.