Lesson 8: Exploring probability
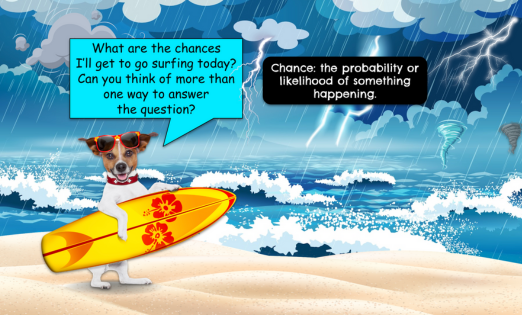
Students will explore probability vocabulary and use it to order the likelihood of events.
Lesson 7: Exploring timetables
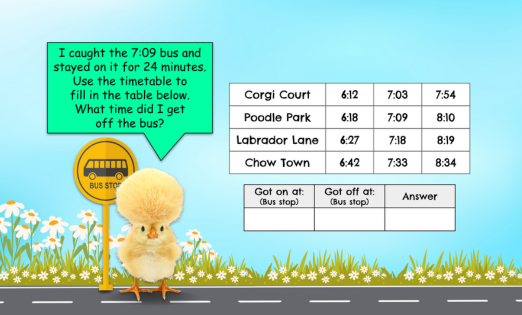
Students will read a bus timetable and solve the animals’ problems by calculating elapsed time.
Lesson 6: Mean, mode, median and range
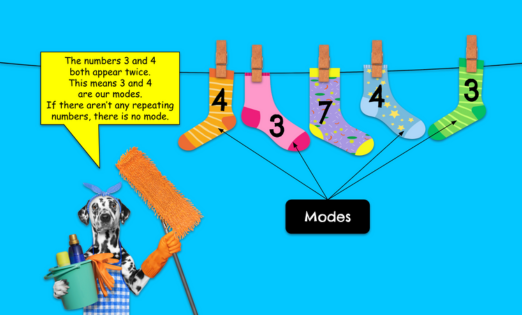
Students will explore and calculate the mean, mode, median and range of data sets. They will find the averages of the ‘hanging socks’.
Lesson 5: Calculating mean average
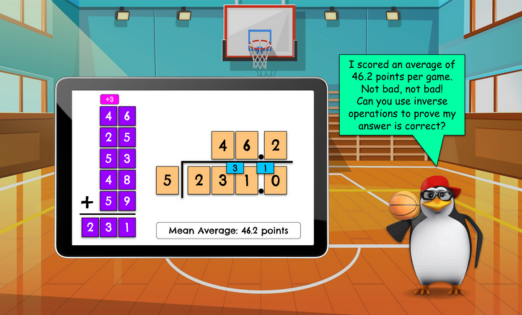
This lesson inquires into calculating the mean average of different data sets. It only covers the mean average, as median, mode and range are explored in the following lesson.
Lesson 4: Gathering and presenting data
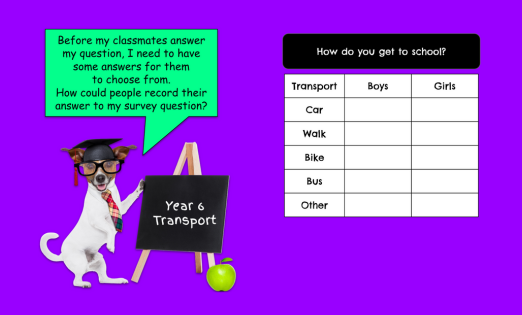
Students will gather data and present it in a graph.
Lesson 3: Drawing pie graphs
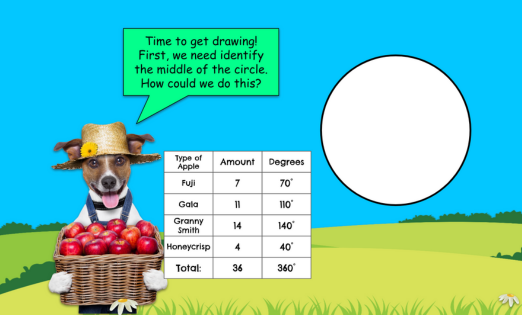
Students will apply their knowledge of angles and data from collections to draw pie graphs.
Lesson 2: Interpreting pie graphs
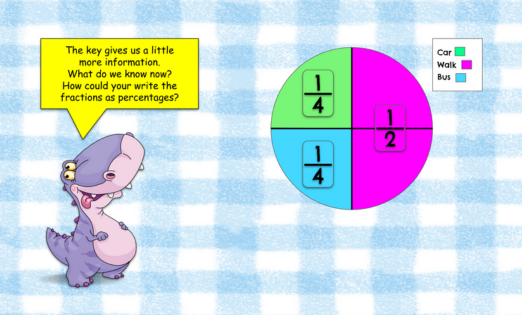
Students will explore pie graphs in more detail and interpret the data from different pie graphs.
Lesson 1: Interpreting graphs
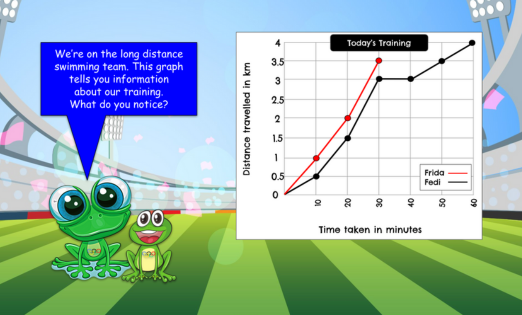
Students will reflect on what they already know about data and interpret bar graphs, line graphs, line plots and pie graphs.
Lesson 14: Shape and Space Assessment
This is a summative assessment that covers the key objectives from this shape and space unit.
Lesson 13: Making and describing translations
Students will design a map and describe translations to visit sites on a map.